
I’ve been starting to use Azure Sentinel recently and explore some of its capabilities – there are currently about 40 built-in data-connectors that take logs from different services/products.
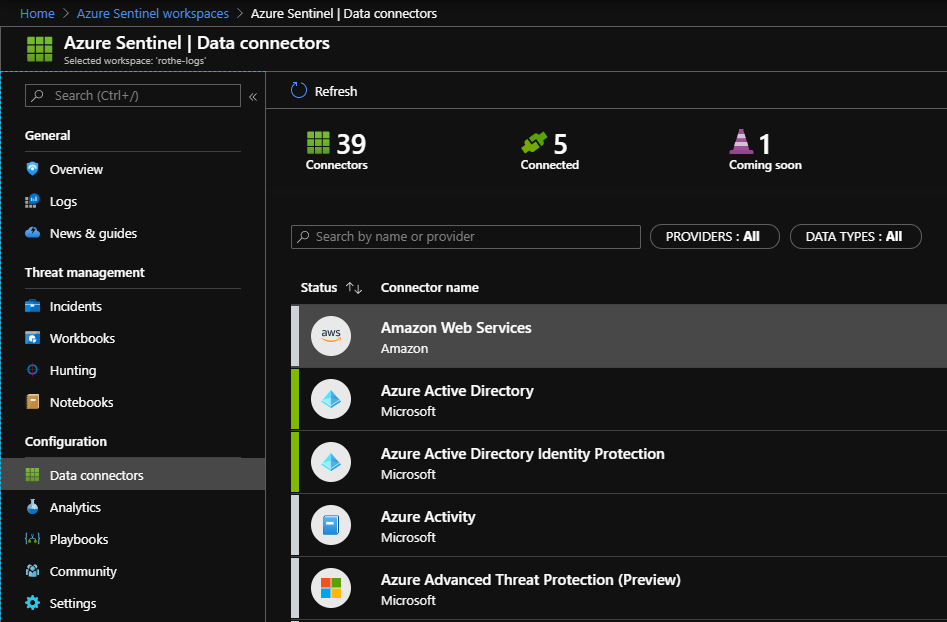
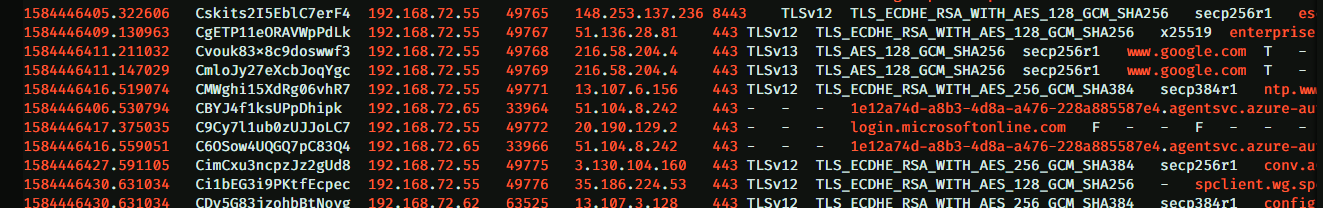
I decided to see if I could add integrations with some open-source network tools and Zeek (formerly Bro) seemed like a perfect place to start. Rather than logging packets that match a specific rule (as is the focus of Snort/Suricata), Zeek can be configured to log pretty much anything, out-of-the-box it logs metadata on all SSL connections, DNS lookups, HTTP requests etc.
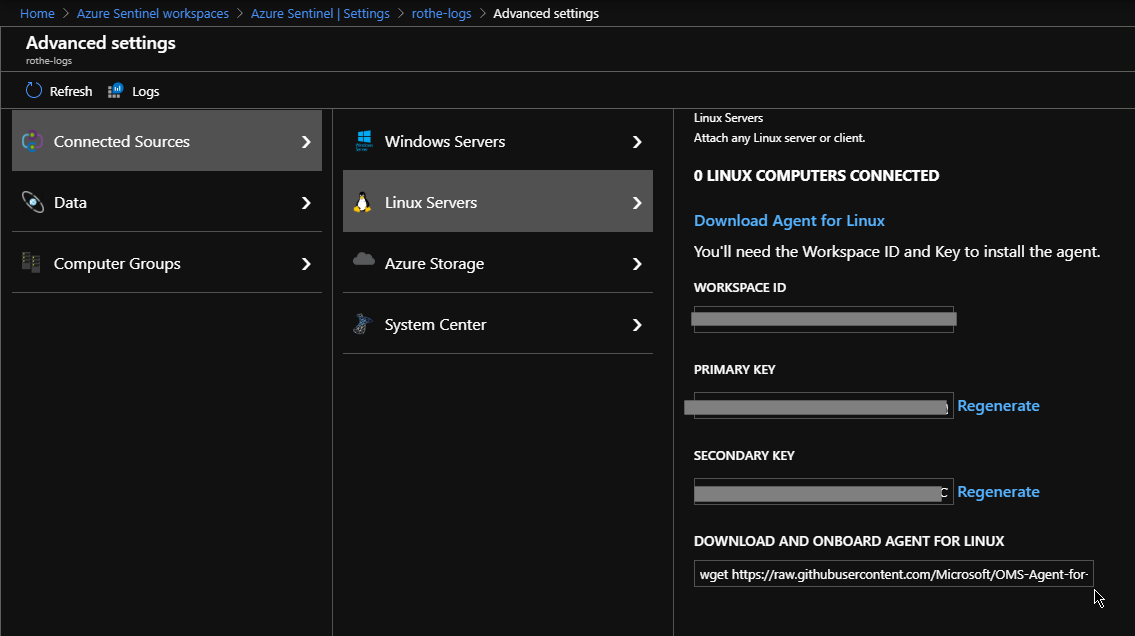
I won’t go through the basic setup for Zeek since that’s much better documented elsewhere, suffice to say I installed Debian 10 on a small physical box and then installed Zeek via Apt. I then installed the Azure OMS agent which collects logs and sends them into Azure.
At this point I began to run into issues, logs weren’t being ingested into Log-Analytics and the OMS agent logs showed:
Stream error in the HTTP/2 framing layer. Make sure Curl and SSL libraries are up to date.
Some testing with Curl led me to the following issue which was fixed in a newer version on Curl than the one available in the stable release of Debian.
After some messing about with installing testing versions of curl/libc6 (and breaking more things than I fixed) I checked the Curl version in latest version of Ubuntu, found that it was newer and nuked the Debian install in favour of ‘Eoan Ermine’. I’m confident that someone with more Linux skills could have resolved this but I just wanted to get it working!
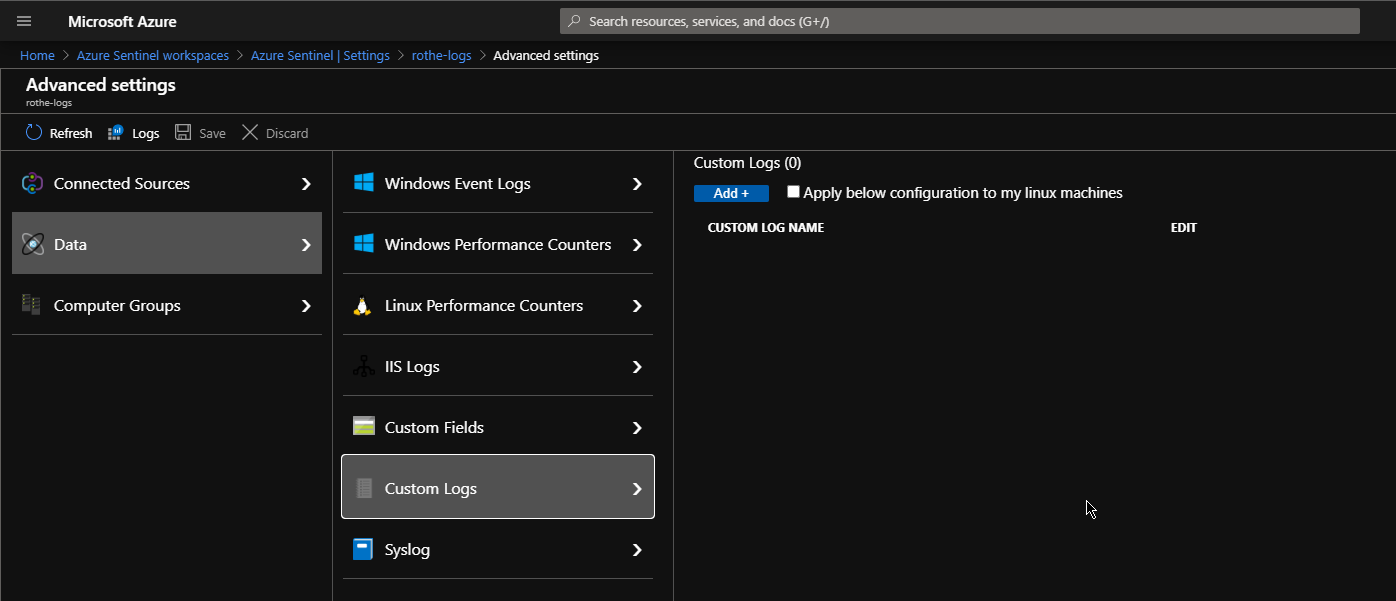
So I’ve now got a machine logging network events into /opt/zeek/logs/current/ and a connector that can ship logs into an Azure Log Analytics workspace, just need to get those 2 connected together! In the Advanced Settings of the log-analytics workspace there’s a blade for Custom Logs.
In order to use this we first need to grab a copy of a sample log file from the Zeek logs directory – I’ll start with DNS as it’s a really great source of data. I removed the first 8 lines from the start of the file so that the first line is the first record.
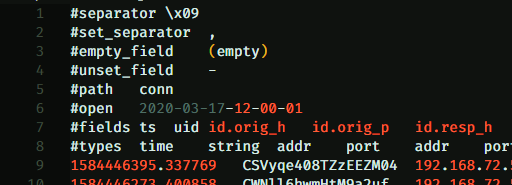
Headers at the start of the file that you’ll want to strip out.
It’s useful to copy the list of fields to another file to reference later. I then informed azure that the logs entries were separated by line-breaks.
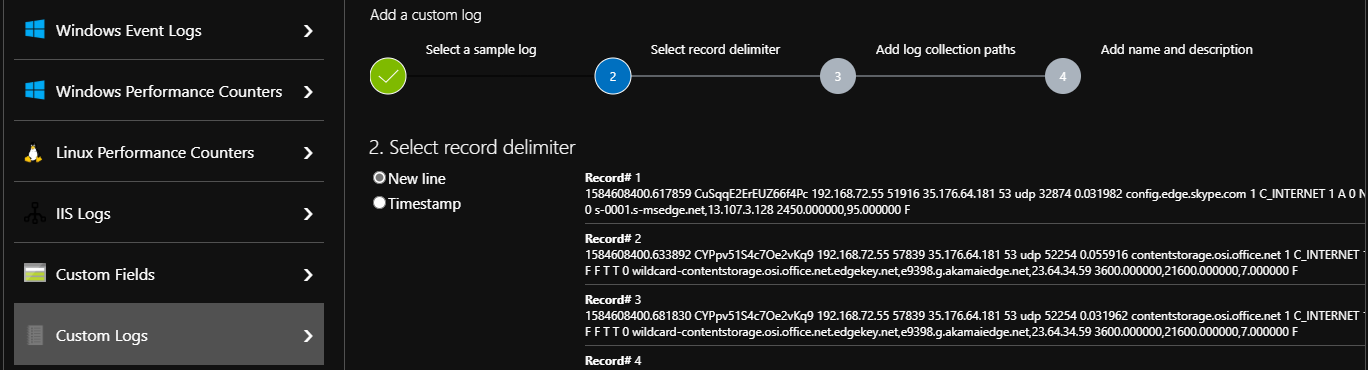
Note there’s no need to define individual fields at this point – each log entry will be stored as a string and analysis happens when they are queried – this means even if the log format changes in future, the data will still all be stored.
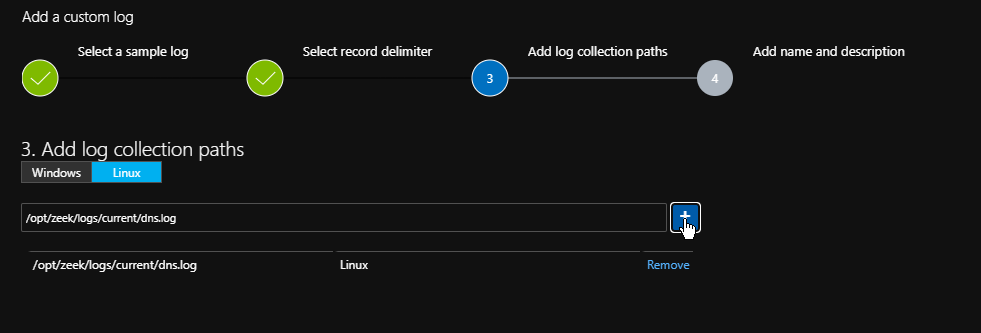
The final steps are to tell the agent where it should look for this log file and to give it a snappy name.
Once you’ve added the custom log and saved the configuration it can take up to 20 min before you start seeing the new log entries in Sentinel, this is a good opportunity to go through a few more log types and get them set up.
When you are getting some data into Sentinel, it’s time to start parsing out some useful fields from the logs, since the Zeek logs are tab delimited, the easiest way to handle these with KQL is to split the string into a dynamic field using the split function and then create individual fields from there.
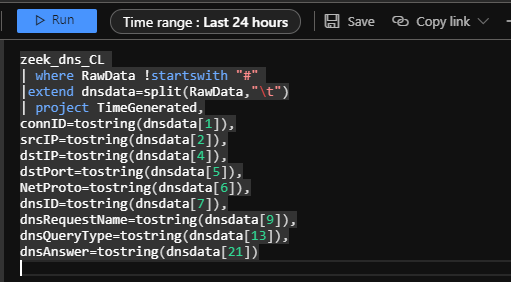
I recommend saving the parser for each type of log as a function, this means you can then use it to write simpler queries later.
It’s also useful to remember that the connection ID is consistent across the different log files, this means you can join various tables on that field.
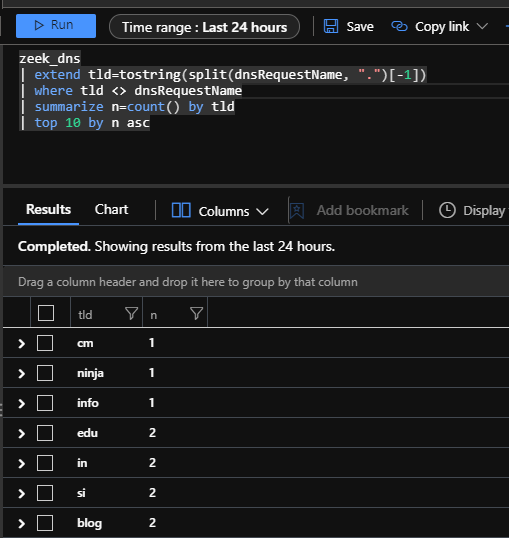
Some ideas for using DNS logs in Sentinel:
- Alerting on DNS responses that match IPs from Threat Intelligence
- Hunting queries that look for domains with unusual or suspicious TLDs
- Identifying devices doing DNS requests against unusual or unauthorised nameservers
- Adapt some of the analytics templates that reference the Windows DNS data to use the Zeek data instead
There are a lot more Zeek logs that you can enable, for instance SMB, RDP, SIP and you can also write your own scripts for decoding interesting traffic.

Martin Rothe
Martin is a Security Engineer working in the N4Stack Security Operations Center (SOC) – His job involves designing and deploying security solutions for customers, responding to security incidents, and investigating new technologies and techniques to protect users, networks and data from the bad guys.
Want to find out more about Martin? Click here