
What statistics does SQL Server use for my query?
A query that’s generally performing fine, suddenly slows down to unacceptable levels. The support desk is lit up by furious users, the manager’s now watching over your head and whilst the panic levels are up, a calm and collected approach is the only way to get this fixed.
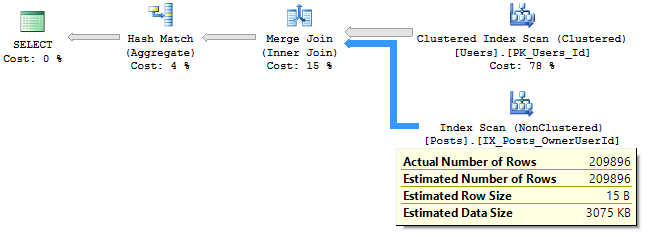
Here’s the execution plan of the badly performing query and it’s easily noticeable that there’s a statistics issue.
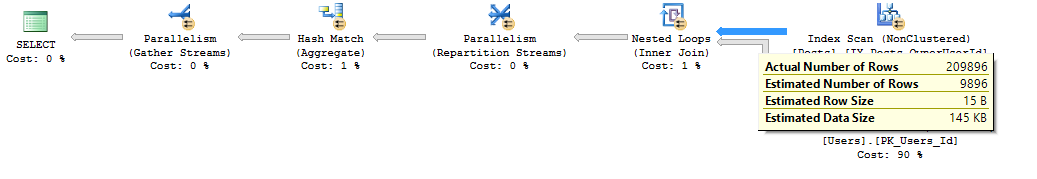
The “dark art” of SQL Server has just gone wrong, as we have stale statistics!
Opening the “Statistics” section of the table within the Object Explorer shows tons of them. A thought goes through your head, “Why does SQL Server create so many statistics automatically”. Well, that’s the least of our problems at this point in time.
A word of caution here: NEVER update all statistics on the table. On big tables, where you’re likely to see such problems, updating statistics with full scan on auto-created statistics would scan through the entire table. Doing this for entire table means scanning through the table as many times as the number of these statistics on your table. Yes, SQL Server does not update multiple statistics with one scan! …………………..Imagine the IO explosion!
So you’re wondering which of these statistics is the problem and which one needs to be updated. There’s one way to find out which. You guessed it – trace flags. So here goes the caveat. The trace flag used here is UNDOCUMENTED and would, therefore, suggest using it with great caution. If using in production environment, then only enable the trace flag for the SSMS session used to troubleshoot the problem. However, it would be recommended to refresh the pre-production environment to try and replicate the issue in the first instance.
Let’s start by turning on trace flag 8666.
DBCC TRACEON(8666)
This enables further information to be made available for debugging when you look at the execution plan properties.
Now execute the query with “Include Actual Execution Plan” enabled (I hope you’re trying this on your test server), right-click the root node of the plan and select “Properties”. You will see an extra section (Internal Debugging Information) which looks as below:
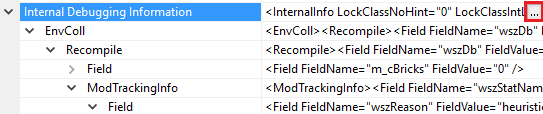
If you click on the ellipsis button to the right, a separate window will pop up, displaying the entire XML of the InternalInfo. The interesting section for us here is the ModTrackingInfo.
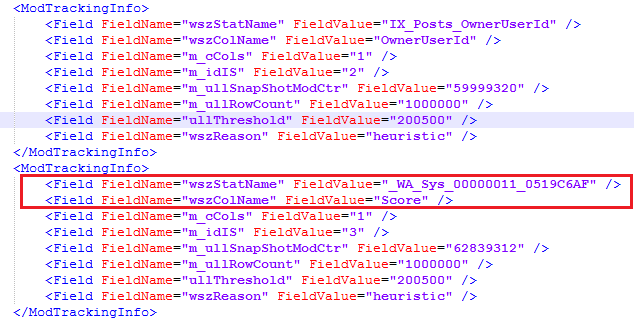
This shows exactly the statistics used by SQL Server for cardinality estimation and the one(s) to update, in order to improve the query performance in question. Sure enough, updating this gives a much accurate estimation and a plan optimal based on that.
At this point it’s also worth noting that another trace flag 2371 enables SQL Server to use a dynamic threshold which would help mitigate statistics going stale on larger tables. This trace flag is well documented by Microsoft here.
If you’re using SQL Server 2016, however, this is the default behaviour as it already uses the improved algorithm. Light at the end of the tunnel!
Hope this proves to be a useful article to help diagnose some of your hidden problems.